Crown Estate Scotland announced the outcome of the ScotWind Lease round in January 2022, with 17 projects awarded option agreements. The 17 projects have a potential total capacity of almost 25 GW of offshore wind – both floating and fixed.
Transition Economics has analysed the ownership and jobs potential outcomes of ScotWind lease round for the Scottish Trades Union Congress. This analysis was covered by The Herald’s here.
- Potential Job Creation from ScotWind leases
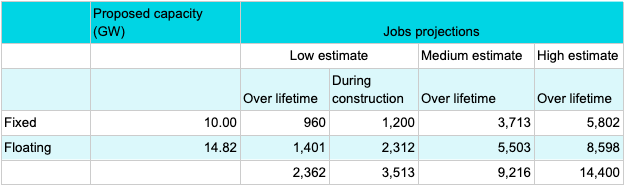
Transition Economics has modelled the potential job creation from the 17 proposed offshore wind projects, over the lifetime of the projects during pre-development, construction and the operational phase. In our low estimate, we also broke this down into job creation during the construction phase.
In a scenario with high levels of local content and significant domestic fabrication, 14,400 jobs could be created in Scotland across the lifetime of offshore wind farms.
However, in a scenario with limited local content – primarily focused on pre-development, operations and maintenance and limited installation – the 17 offshore wind farms could deliver less than 2,500 Scottish jobs over the same period.
Our methodologies for estimating job creation from new offshore wind projects was developed in our analysis for the Scottish Trades Union Congress, and published in the Green Jobs in Scotland report in April 2021. Jobs “over lifetime” include pre-development, construction and installation, operations & maintenance, and decommissioning.
Crucially, reaching the medium or high end estimates will require significant pro-active government measures to drive investment and expansion of the Scottish offshore wind supply chain – beyond current government policies.
In response to the ScotWind lease results being announced, the Scottish Government said that “Because Scotland’s workers are superbly placed with transferable skills to capitalise on the transition to new energy sources, we have every reason to be optimistic about the number of jobs that can be created.
That means, for example, that people working right now in the oil and gas sector in the North East of Scotland can be confident of opportunities for their future.”
“The spread of projects across our waters promises economic benefits for communities the length and breadth of the country, ensuring Scotland benefits directly from the revolution in energy generation that is coming.”
To ensure the desired job creation becomes a reality, the Scottish Government should enact appropriate policies, such as:
- Public investment of £2.5 billion – £4.5 billion to 2035 in ports and manufacturing to supply large scale offshore renewables
- Setting up a Scottish National Energy Company, to participate in developing and deploying new offshore wind farms
- Expand local content (as practiced in France, Turkey, Taiwan and elsewhere) and local hiring requirements, with stronger accountability measures to ensure targets are met
- Skills programmes to address shortages, and remove barriers to renewables jobs for oil and gas workers.
2. Analysis of Ownership
Transition Economics has analysed the ownership structures and countries of origin for the 26 parent companies behind the joint ventures acquiring the 17 ScotWind leases. This enabled us to create a breakdown of the proposed offshore wind capacity (in GW) by location and by public or private ownership structure.
The best majority of the leases are owned by companies ultimately based outside Scotland: over 23GW, representing 95% of the total. Only 1.3GW are owned by companies based in Scotland.
2.5 GW of proposed capacity (10% of the total) are controlled by publicly-owned entities, from Sweden, Denmark, Belgium and Germany. The remainder (90%) is owned by private companies. None of the proposed new wind farms have ownership participation from public UK or Scottish entities.
Table 1: Scotland Ownership: Capacity (GW) by ownership structure & location

Table 2: Scotland Ownership: Percentage by ownership structure & location

Table 3: UK Ownership: Capacity (GW) by Ownership structure & location

Table 4: UK Ownership: Percentage by Ownership structure & location